
Takaful Insurance Dashboard - Tableau
Takaful Insurance Dashboard
Understanding the origins of the Customers
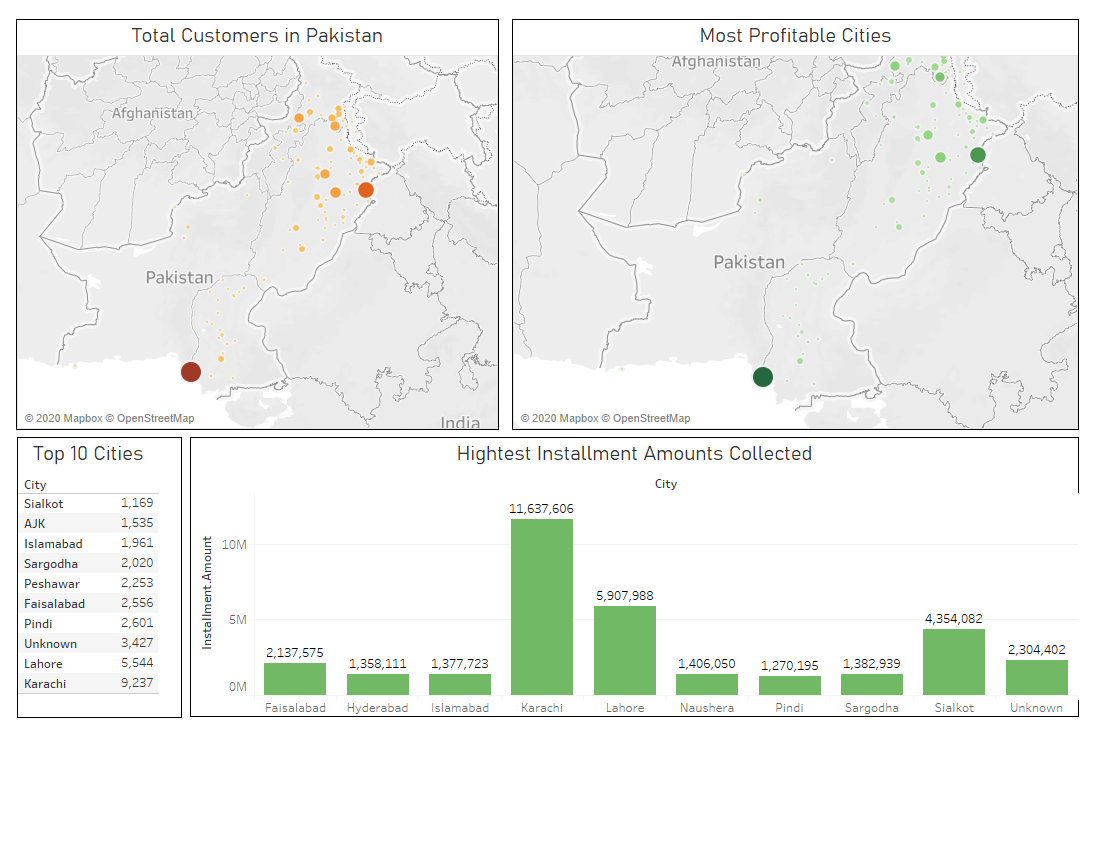
In order to perform customer segmentation, the first step is to identify where the customers are coming from and what is their standard behavior with respect to their geographical location. The first Analysis includes:
- Total entries/insurance records with respect to location*
- Total Amount Paid with respect to Location*
- Highest Installment amounts per city
This analysis was restricted for cities of Pakistan only, in order to simplify the domain.
Insights:
- Karachi stands to be the city with highest Number of Insurances, Total Payments, and Installment Amounts.
- The Company has been successful in targeting customers in the region of Upper Punjab more than in any other region, as supported by Visualizations.
Customer Segmentation
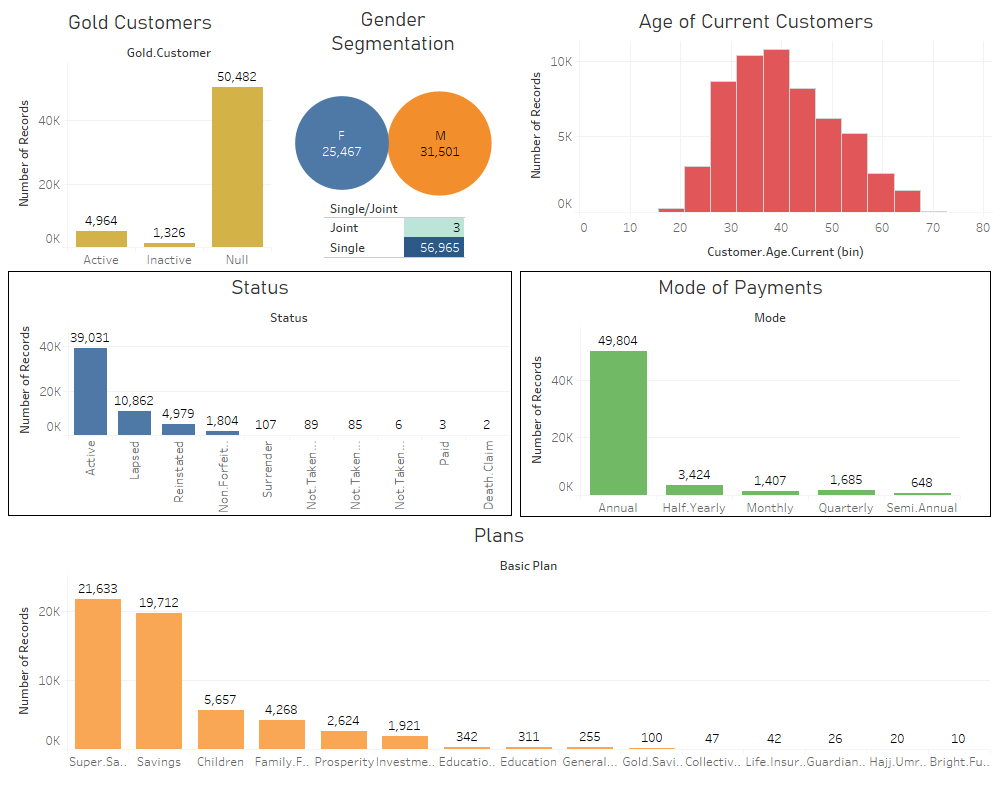 This Dashboard helps understand the persona of customer base. By the help of this Dashboard, we could see that:
- This helps us understand that Gender doesn’t matter much when it comes to insurance. It is of equal importance for both the genders.
- Almost ALL the customers go for Single Account type.
- Majority of customers are not really profitable to be tagged as Gold Customers.
- The mean age bracket of customers who pay for the insurance is 35-45. This shows that people with financial stability, and smooth income go for Takaful insurance subscription.
- A huge percentage of customers subscribe to an Annual Payment procedure.
- Super Savings plan stands out to be the most popular Plan offered by the company.
Financials
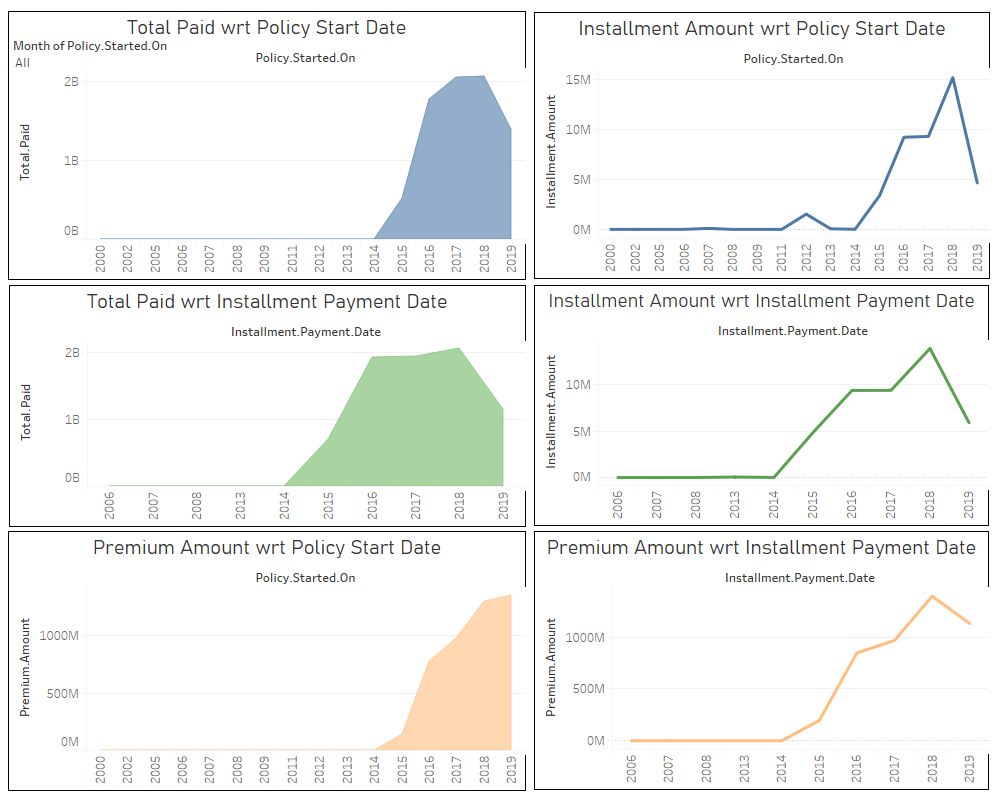
The above graphs show us that proper data collection procedure and framework was implemented from 2014 onwards. On the other hand, it helped us in identifying the following insights:
- 2018 was the most profitable year in terms of Gross Payments Collection.
- The above point is supported by the highest installment rate indicated in 2018.
- The pattern of payments collection was almost consistent across 2017 and 2018.
- 2019 turned out to be a problematic in terms of payments collection due to:
Analyzing the Gold Customers
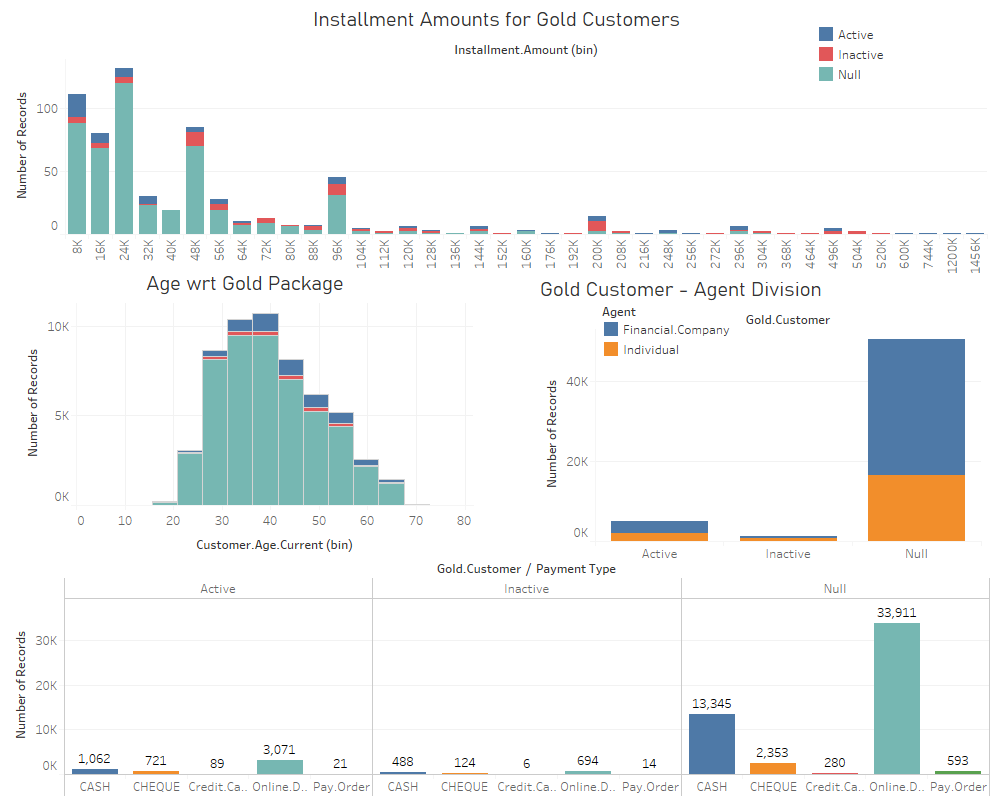
- Active and Inactive both customers lie at both ends of the installment amounts chart. But this can be observed that Gold customers pay high Installment amounts.
- The Age bracket of Gold customer is 25+ that shows that people with financial stability are more likely to become Gold Customers.
- Financial Company Agent type seems to be in majority. Same is observed with Gold Customers.
- Online Debit Payment Method can be observed as the popular mode of Payment for Both Gold and not Gold Customers.
Agent Wise Analysis
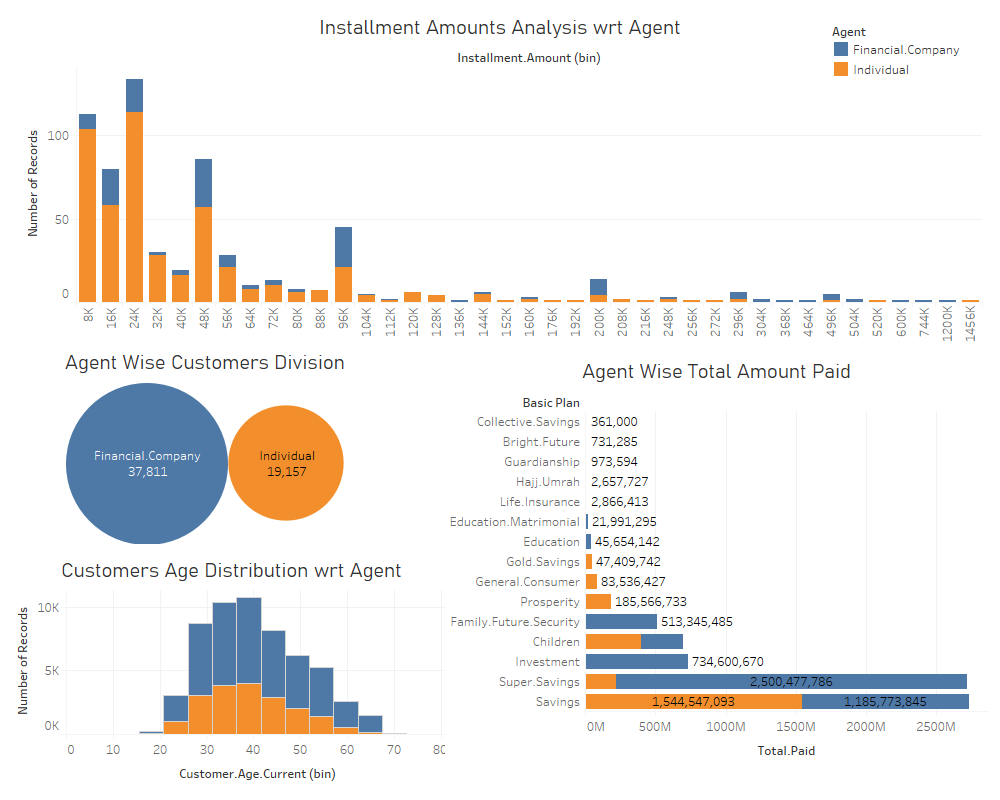
- For this Insurance company, the Financial Company Agent type has turned out to be MOST Profitable.
- This can be backed up by the fact that there are more customers in that category in comparison to Individual one.
- The Customers Age distribution is fairly similar for both of the Agents Type.
- Savings and Super Savings are the most profitable Plans for the Insurance Company.
- For some records, Installment amounts are extraordinarily high for Financial Company, while the overall average installment amount is nearly same for both the Agent Types.
Status plays a Major role
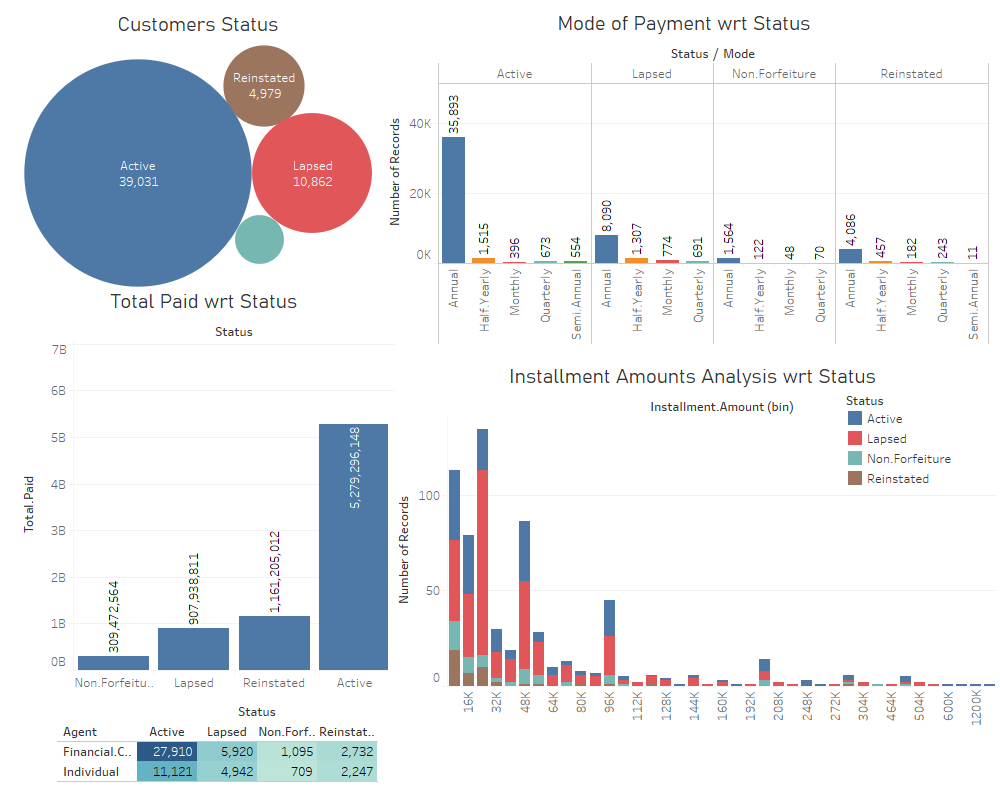
The status of the customers reveals some important insights that can help devise a strategy for targeted marketing of new insurance policies.
- Around 39,000 customers are currently Active.
- The company has an attractive annual payment model which is why It is the most preferred.
- It was fairly straight forward to conclude that most revenue came from active customers.
- The average installment bracket is 8K-48K irrespective of Status.
- Financial Company Agent Type turns out to be outperforming the Individual Agent Type in terms of bringing more customers to the table and in turn more revenue.