
ExplorAid
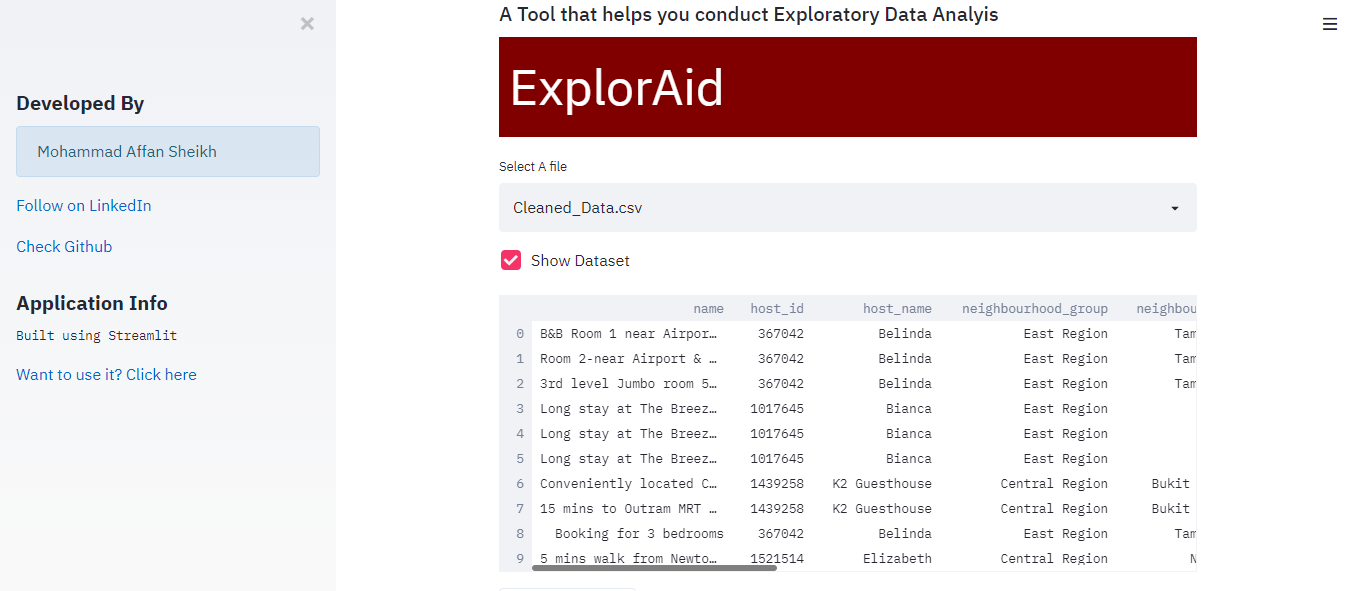
ExplorAid is an Exploratory Data Analysis Tool which helps you understand the data in an easy way. It would give you a basic idea of what the data is like.
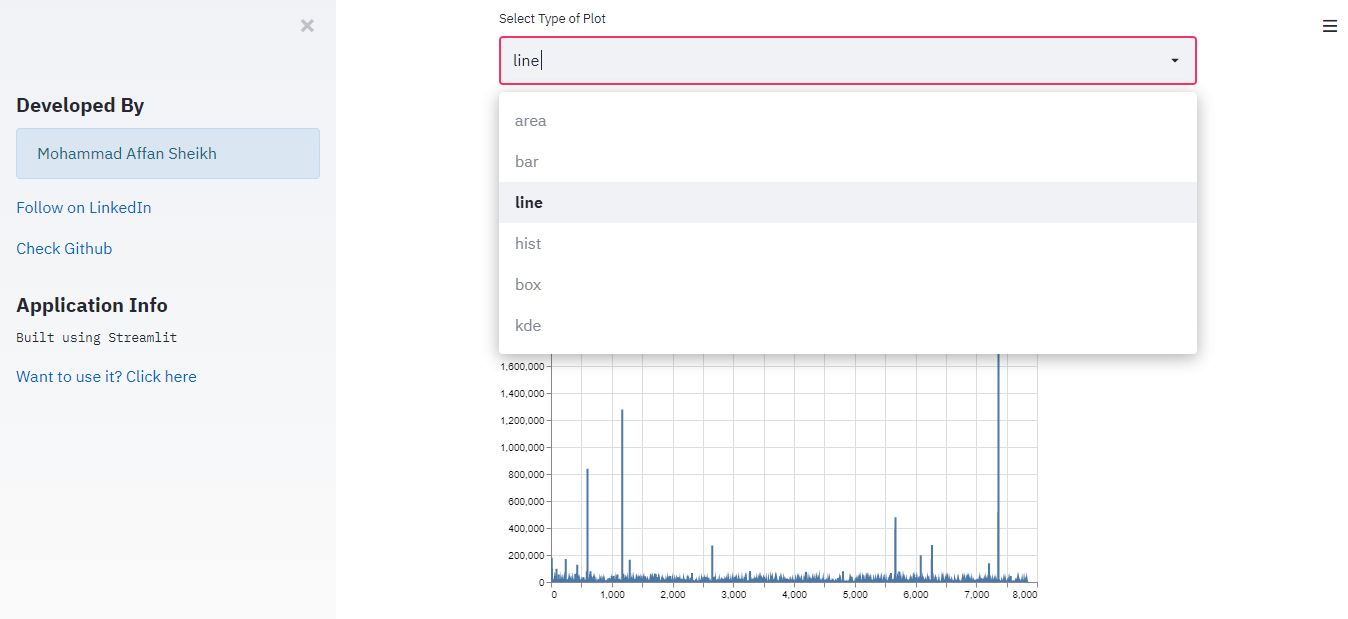
Apart from the basic EDA functions. It also provides the functionality of performing Data Visualizations just by selecting the columns and the type of chart that you want to make.
This Application requires:
- Streamlit (pip install streamlit)
- Python3
- Text Editor (I use Sublime Text)
Check Github Repository
Demo:
Upload your dataset into the datasets folder of the repository
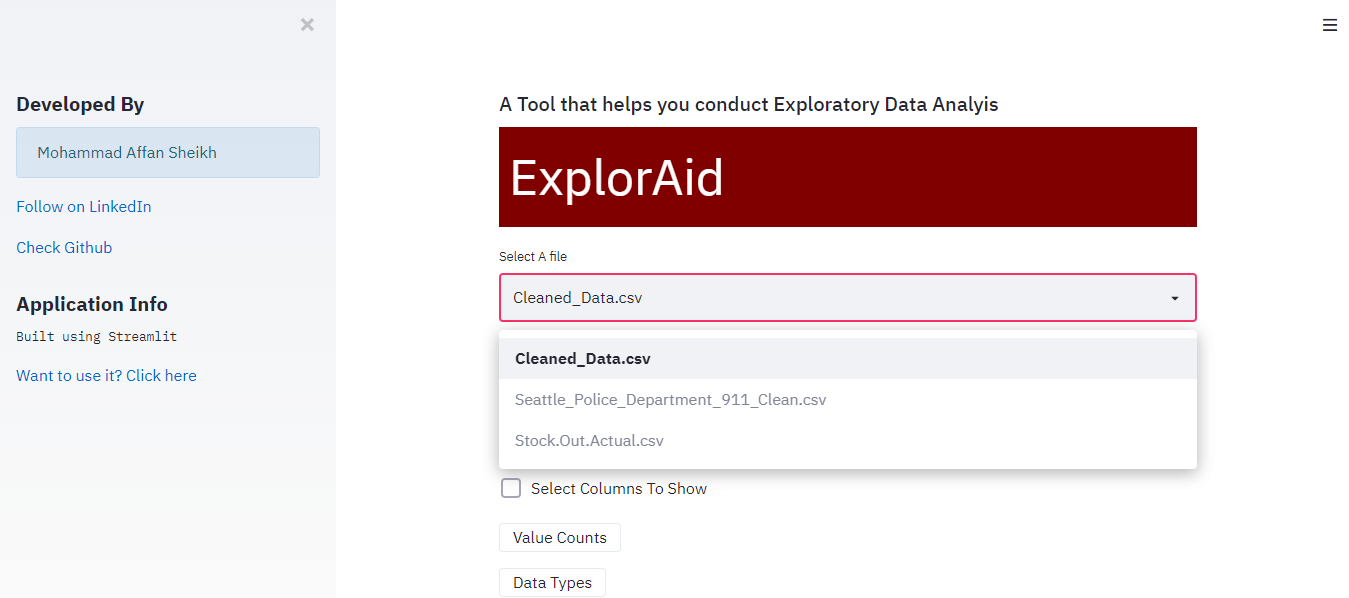
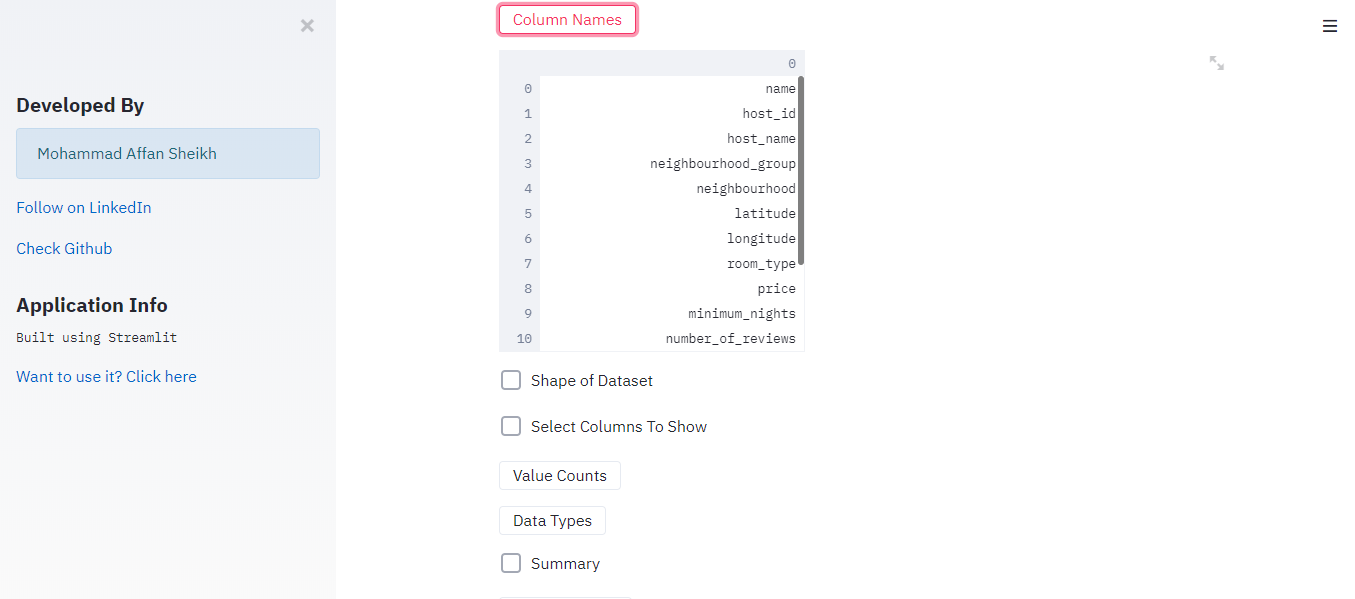
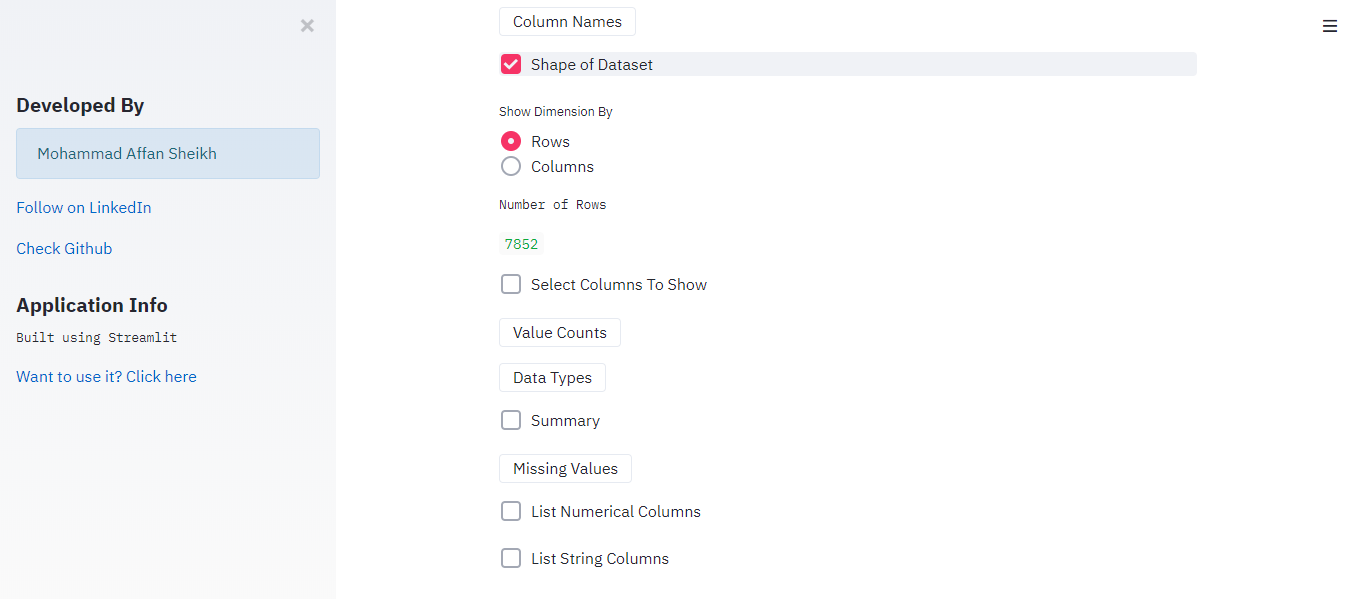
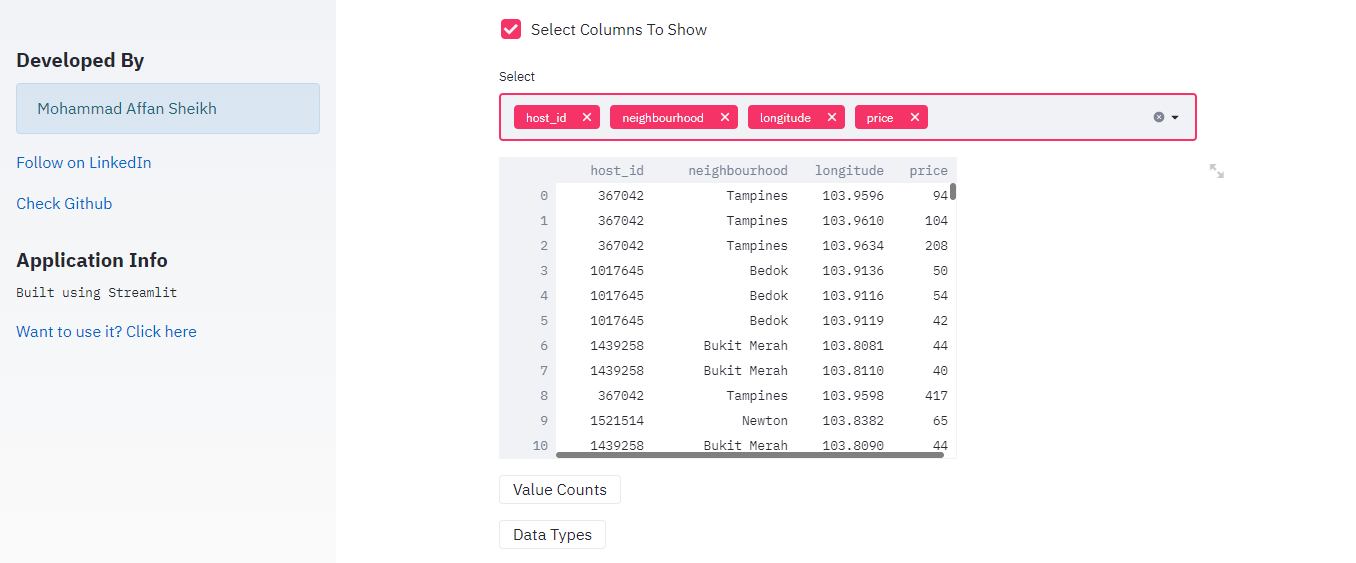
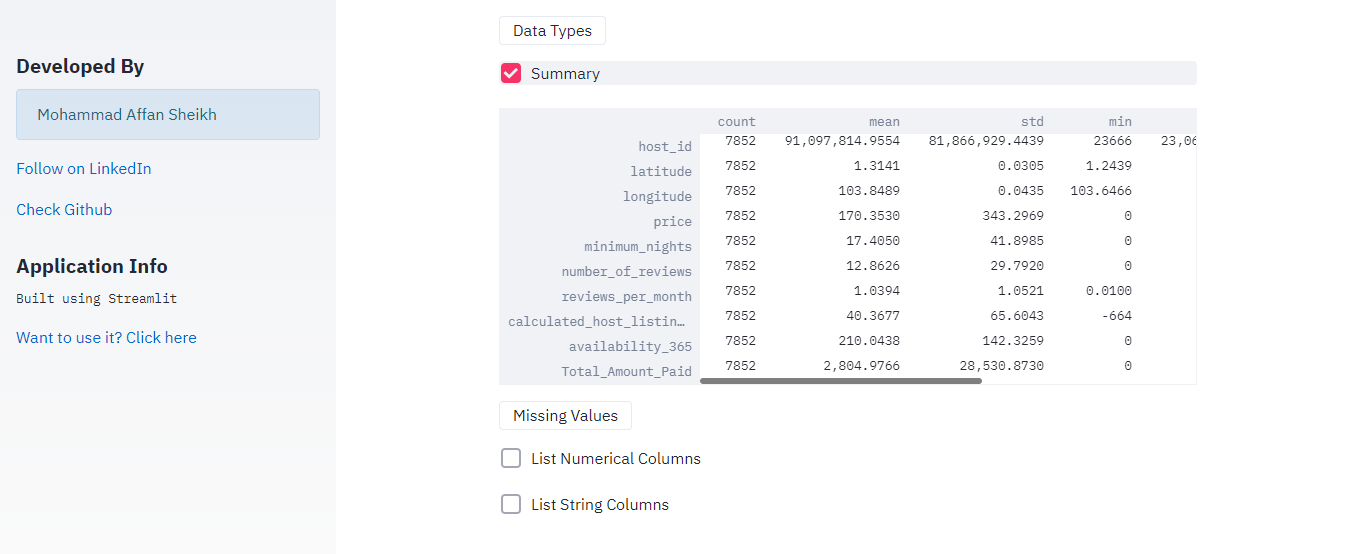
Explore your dataset
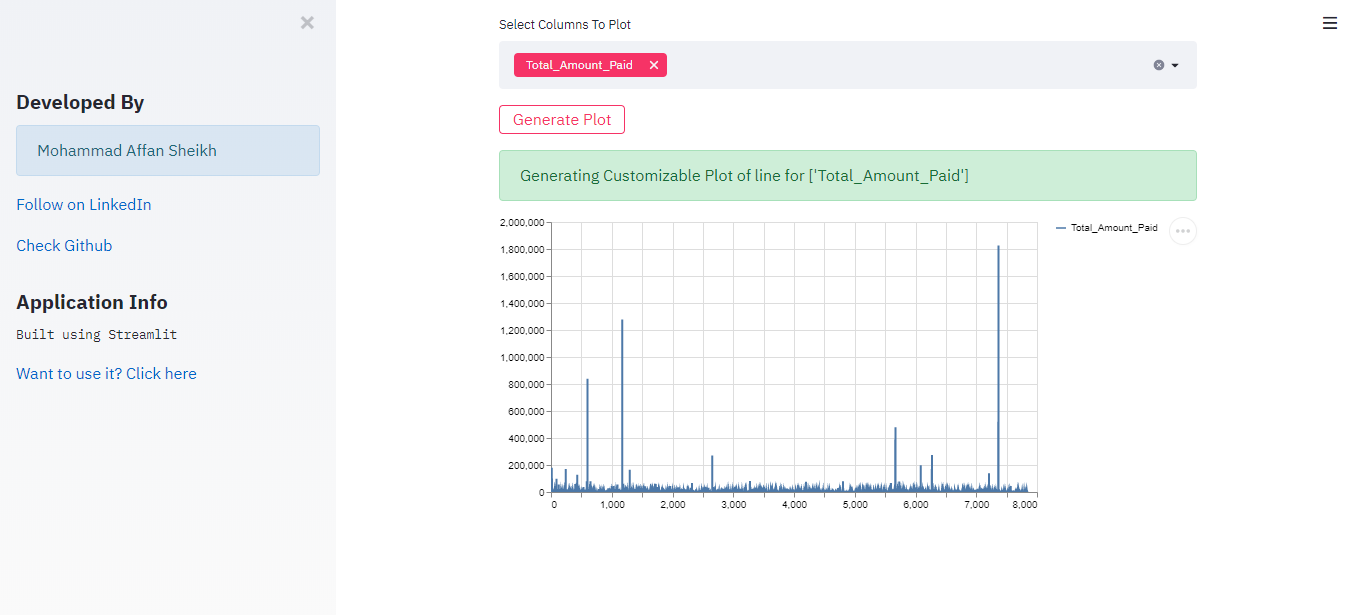
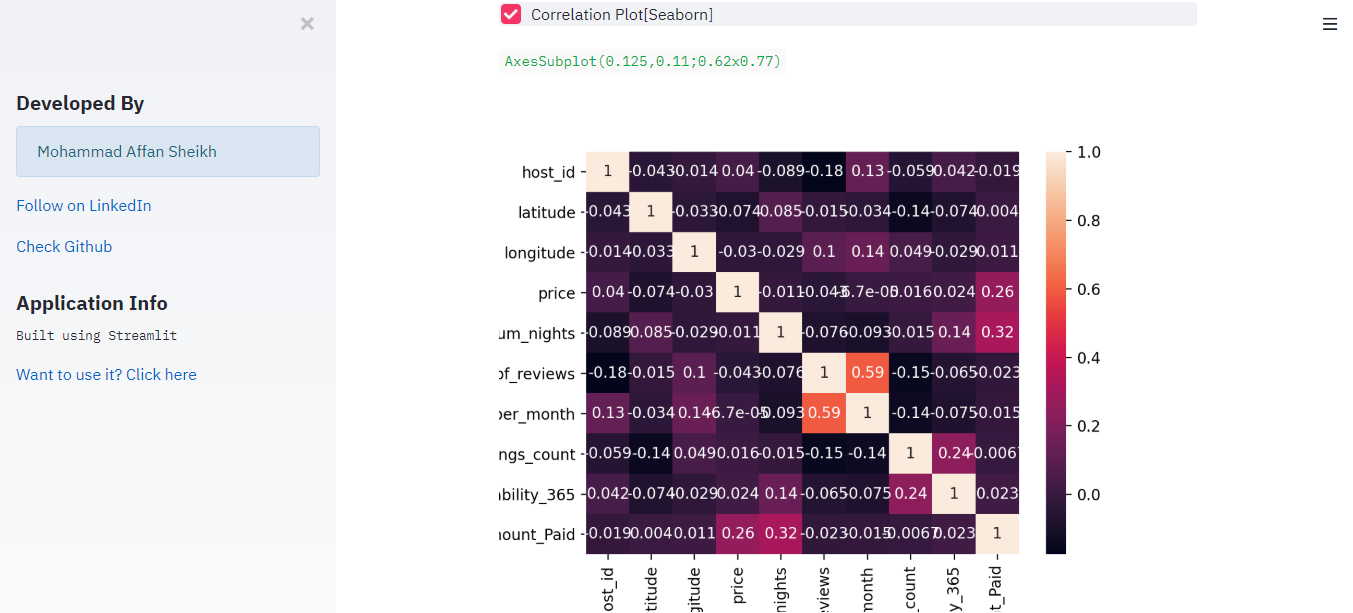
Visualize your dataset by using the Data Visualization features
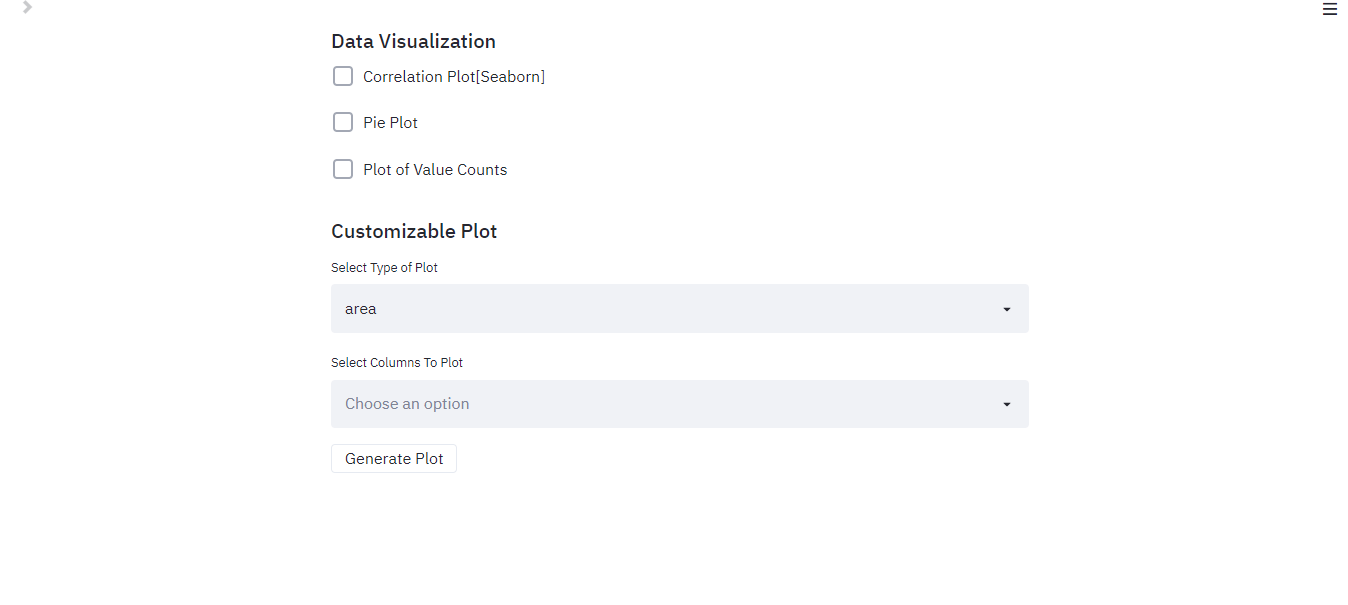
Make charts of your choice using particular features